

Beyond Wall Street: Trading Software for the Physical ChokePoints of the Global Economy.

If you own the S&P 500 or a global tech fund, you don’t own a globally diversified portfolio. You own a U.S. consumer engine with an overseas sales team. There is a massive structural difference between earning global revenues and diversifying across global industrial moats.
The prevailing logic sounds comfortable: “U.S. companies operate globally, earn their revenues globally, so buying the S&P 500 is fundamentally global investing.”

This is one of the most persistent myths in modern asset allocation. It conflates global revenue exposure with structural macroeconomic diversification.
When you rely entirely on a single domestic market, no matter how dominant its capital markets are, your capital is structurally blind to localized supply chains, resource monopolies, and industrial moats that simply cannot be replicated on Wall Street.
True global allocation isn’t just about changing currencies on a spreadsheet. It is about identifying specific structural capabilities that are physically or technologically absent from your home economy.
An immediate map of what you will explore:
The Global Revenue Myth: Why buying U.S. tech giants doesn’t give your portfolio true macroeconomic diversification.
South Korea’s AI Moat: How the country locked down a global monopoly on the physical hardware and High-Bandwidth Memory (HBM) driving the AI boom.
China’s Critical Minerals Chokehold: The structural bottleneck behind the global green energy transition and advanced manufacturing.
Europe’s High-Precision Pricing Power: Why specialized automation and elite consumer luxury conglomerates remain completely insulated from inflation.
South America’s Resource Hedge: Utilizing pure-play physical commodity engines as a vital structural counterweight to Western consumption cycles.
The Dual-Engine Return Model: How currency fluctuations (FX Risk) can quietly double your investment gains—or wipe them out entirely.
The Indian Tax Funnel: Navigating the exact rules for overseas investing, from the 12.5% LTCG rate to claiming Foreign Tax Credits via Form 67.
The LRS Cash Drag: Understanding how the 20% Tax Collected at Source (TCS) impacts your portfolio liquidity when sending capital abroad.
The Compliance Baseline: The essential steps for reporting foreign fractions in Schedule FA to stay perfectly aligned with the Indian ITR.
International Performance Under the Lens: A raw, net-return breakdown of the Eurozone, Japan, China, and Latin America after accounting for local taxes and currency friction.
Let’s look at how the economic dominoes actually fall when you expand your framework to multiple, highly specialized international markets.
1. South Korea: The Physical Engine Room of AI Infrastructure
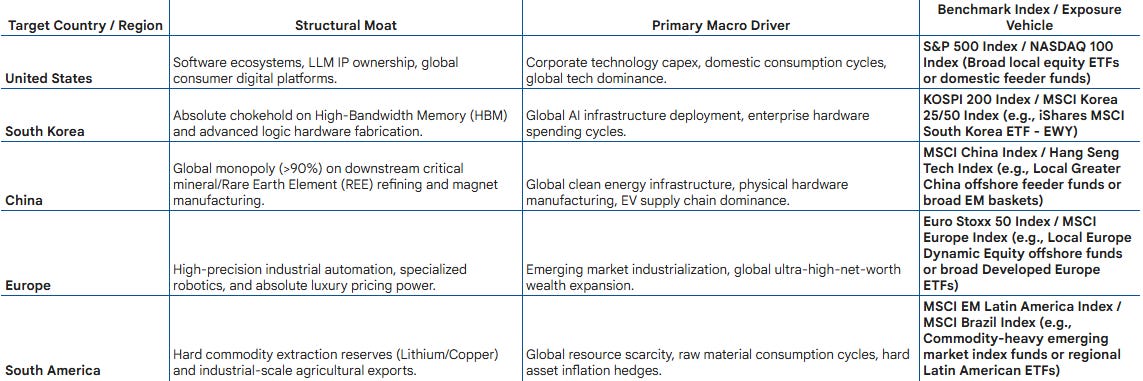
While the United States commands an undisputed lead in consumer-facing artificial intelligence software, large language models, and cloud infrastructure, it lacks a self-sustaining physical ecosystem to build the hardware. Software cannot run without specialized silicon, and advanced silicon cannot function without High-Bandwidth Memory (HBM).
This is where South Korea’s structural moat becomes a mandatory macro exposure.
South Korea has institutionalized its tech dominance via initiatives like the $471 billion K-Semiconductor Belt program. The country controls the global supply of cutting-edge HBM architectures and advanced logic chip fabrication chains. If your investment framework is designed to capture the structural value re-pricing of global AI infrastructure, holding only U.S. software or fabless design firms leaves a massive component of the value chain completely unhedged.
2. China: The Downstream Critical Minerals Monopoly
A major blind spot for domestic-focused investors is the physical layer of the global energy transition and high-tech manufacturing. You cannot build electric vehicle powertrains, precision aerospace equipment, defense guidance systems, or wind turbines without Rare Earth Elements (REEs).
While countries like India are aggressively expanding domestic manufacturing capacities, they face a hard geological and industrial constraint: the downstream refining bottleneck.
China doesn’t just mine roughly 60% of raw rare earth elements; it controls over 90% of the world’s downstream refining, chemical processing, and rare-earth magnet manufacturing. For an analyst tracking geopolitical trade leverage, resource nationalization, or raw material supply chains, the Chinese market holds an absolute structural chokehold on the physical economy that you cannot replicate by purchasing a software or consumption stock in an indigenous index.
3. Europe: High-Precision Automation and Inelastic Moats
The European equity market is rarely discussed as an aggressive tech-growth engine, because it isn’t one. Instead, Europe’s macro value proposition lies in its concentration of asset-heavy industrial monopolies and unprecedented pricing power.
Precision Engineering: Europe houses the global standard-bearers for high-precision industrial robotics, specialized toolmaking, and complex manufacturing automation. When emerging economies expand their industrial baselines, they import European capital goods to do it.
Inelastic Consumer Moats: The continent hosts luxury conglomerates that operate completely outside standard inflationary pressures. These firms possess absolute, inelastic pricing power across global consumer brackets; their margins remain robust even during broad macroeconomic slowdowns because their customer base is insulated from typical credit cycles.
4. South America: The Pure-Play Resource Inflation Hedge
When global liquidity cycles shift and structural inflation rises, physical assets historically outperform paper assets. South American markets operate as a vital macroeconomic counterweight to consumption-heavy Western economies.
From Brazil’s industrial-scale agricultural and iron ore export engines to the lithium-rich regions of the Andean corridor, these markets represent pure commodity playbooks. Their equity cycles are fundamentally un-correlated with Western tech or consumer discretionary cycles, moving instead to the beat of global resource consumption and structural undersupply.
Implementation Strategy: How to Execute Safely
When navigating these international waters, execution strategy is everything.
If you are managing your portfolio on a Do-It-Yourself (DIY) basis, I am absolutely not suggesting that you go out and buy concentrated exposure in individual, single-country foreign stocks. Stock picking in unfamiliar regulatory environments, dealing with foreign corporate governance, and analyzing localized balance sheets adds a massive layer of micro-risk that can easily backfire.
Instead, the most balanced and logical path is to utilize broad regional or country-specific index funds and ETFs.
By buying the index, you instantly capture the country’s entire macroeconomic theme whether that is South Korea’s semiconductor baseline or Europe’s industrial heavyweights, while ensuring your downside is structurally balanced across a diversified basket of companies. You get the pure macro advantage without the concentrated company-specific vulnerability.
The Master Framework
To build a truly resilient global portfolio, an analyst must look past the superficiality of country labels and ask a fundamental question:
“What unique industrial capability, geological resource, or structural moat does this specific country possess that my domestic market cannot organically replicate?”
When allocating capital to US equities, the financial math changes completely compared to domestic investing. The evaluation shifts from basic corporate fundamentals to a dual-engine return model: Asset Performance and Currency Dynamics, both wrapper-bound by a distinct tax and compliance architecture.
The Mechanics of Foreign Exchange (FX) Risk
Investing in US stocks means converting Indian Rupees (INR) to US Dollars (USD) to buy the asset, and reversing the process upon liquidation. This introduces currency risk, which acts as a major variable that can either amplify your returns or severely erode them.
USD Appreciates (INR Depreciates): This creates a structural tailwind for Indian investors. If the underlying US stock price remains flat, but the USD strengthens against the INR, your investment value gains in INR terms.
USD Depreciates (INR Appreciates): This creates a headwind. Even if the underlying US stock rallies, a falling USD will drag down your net returns when converted back to INR.
The Mathematical Breakdown (The Dual-Engine Example)
Let’s see how currency movements change the outcome using a real-world scenario.
Baseline Setup:
Initial Capital: ₹1,00,000
Initial Exchange Rate: $1 = ₹80
USD Capital Deposited: 1,250$
Asset: 10 shares of a US company priced at 125$ per share
Scenario A: The Currency Tailwind (USD Appreciates)
The stock performs well, and macro factors cause the INR to depreciate.
Stock Price Movement: Rises from 125$ to 150$ (+20% asset return)
Ending Portfolio Value: $10 times $150 = $1,500$
New Exchange Rate: $1 = ₹85 (INR depreciated by ~6.25%)
Liquidation Value in INR: $1,500 times ₹85 = ₹1,27,500
Net Return in INR: +27.5%
The currency depreciation added an extra 7.5% return on top of the asset’s 20% gain.
Scenario B: The Currency Headwind (USD Depreciates)
The stock performs exactly the same, but the exchange rate shifts the other way.
Stock Price Movement: Rises from 125$ to 150$ (+20% asset return)
Ending Portfolio Value: 1,500$
New Exchange Rate: $1 = ₹75 (INR appreciated by 6.25%)
Liquidation Value in INR: $1,500 times ₹75 = ₹1,12,500$
Net Return in INR: +12.5%
Despite a stellar 20% performance by the stock, currency movements wiped out nearly half of the gains in home-currency terms.
The Tax Architecture for Indian Residents
US investments do not enjoy the same tax concessions as domestic listed equities (such as Section 112A’s lower rates or exemptions). Instead, they are treated under the rules for unlisted foreign assets.
Capital Gains Tax
The US does not levy capital gains tax on non-resident foreign investors. Therefore, 100% of your capital gains are taxed back home in India based on your holding period:
Short-Term Capital Gains (STCG) - Held for 24 months or less: Gains are added to your gross total income and taxed at your applicable progressive income tax slab rate (potentially up to 30% or 39% including highest surcharges).
Long-Term Capital Gains (LTCG) - Held for more than 24 months: Taxed at a flat 12.5% without indexation benefits.
Dividend Income & Withholding Tax
Dividends face a dual-taxation mechanism, but it is managed via treaty relief:
US Withholding Tax: The US automatically deducts a 25% withholding tax at source before the dividend hits your brokerage account (capped under the India-US Double Tax Avoidance Agreement (DTAA), provided Form W-8BEN is filed).
Indian Taxation: India taxes the gross dividend amount at your regular income tax slab rate.
Double Tax Avoidance Relief: To prevent paying twice, you can claim a Foreign Tax Credit (FTC) in India for the 25% tax already paid to the US. This requires electronically filing Form 67 alongside your Indian Income Tax Return (ITR).
Capital Outflow Friction: TCS under LRS
Remitting funds to an overseas broker happens via the RBI’s Liberalised Remittance Scheme (LRS).
Remittances up to ₹10 lakh per financial year incur 0% TCS.
Any remittance above ₹10 lakh triggers a 20% Tax Collected at Source (TCS) on the excess amount.
Note: TCS is not a sink cost or an additional tax penalty; it operates as an advance tax payment. It can be fully adjusted against your overall domestic income tax liability or claimed as a refund when filing your ITR, though it does temporarily lock up capital liquidity.
Calculating the Ultimate Return to Investors
To find the actual net yield of an international portfolio, you must account for structural frictions at both entry and exit.
The Ultimate Net Return Funnel
[ Gross Asset Return in USD ]
           │
           ▼
[ Adjusted for FX Rate Shifts (Conversion to INR) ]
           │
           ▼
[ Deduct: Friction Costs (Bank outward remittance fees, FX spread charges) ]
           │
           ▼
[ Deduct: Dividend Withholding Tax (Net of Foreign Tax Credit adjustments) ]
           │
           ▼
[ Deduct: Indian Capital Gains Tax (STCG at Slab vs. LTCG at 12.5%) ]
           │
           ▼
[ Net Ultimate Realized Return ]
Critical Compliance Reminder
Because these are foreign holdings, absolute compliance transparency is mandatory. Every single overseas share held, including fractional pieces must be meticulously reported in Schedule FA (Foreign Assets) of your Indian ITR, mapped to the calendar year framework.
Omitting these disclosures can trigger significant reporting penalties under the Black Money Act, making systematic tracking of historical cost basis and peak values an essential part of managing foreign equity.
Global Investing: Indian Tax Framework & FX Dynamics
The domestic tax treatment depends heavily on whether you invest directly in foreign unlisted equities (e.g., via a liberalized remittance route) or through India-domiciled international mutual funds / ETFs.
Below is a macroeconomic breakdown of the Chinese, Japanese, Eurozone, and South American markets, tracking how these factors dilute or enhance the historical 10-year annualized performance.
1. The Eurozone Market (Benchmark: EURO STOXX 50)
The Eurozone offers a highly mature corporate environment dominated by consumer giants, financials, and industrial technology.
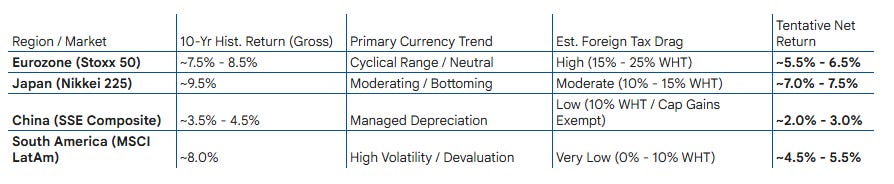
10-Year Average Historical Return: ~7.5% to 8.5% annualized (Gross Total Return).
Currency Trend (EUR): The Euro acts as a major funding and reserve currency. Over a 10-year macro cycle, it has largely traded in a cyclical range against the USD, heavily influenced by the interest rate differentials between the ECB and the Fed. Structurally, it faces moderate demographic and growth headwinds, maintaining a relatively neutral to slightly depreciating long-term trend against the USD, though it offers relative stability compared to emerging market currencies.
Taxation Regime: Navigating European tax is highly fragmented. Standard dividend withholding taxes (WHT) for foreign non-resident investors are steep ranging from 12.8% (France, recently lowered) and 25% (Germany, plus a solidarity surcharge) to 26% (Italy). Double Taxation Avoidance Agreements (DTAA) typically allow these to be capped or credited back at 10% to 15%, depending on your home tax jurisdiction.
Tentative Net Return Outlook: ~5.5% to 6.5%. Capital appreciation is stable but moderate; the primary drag is the high withholding tax on the dividend yield portion of the total return.
2. The Japanese Market (Benchmark: Nikkei 225)
Japan has experienced a massive corporate governance renaissance, forcing companies to improve return on equity (ROE) and increase shareholder payouts.
10-Year Average Historical Return: ~9.5% annualized (underpinned by a historic bull run through 2024–2025).
Currency Trend (JPY): The Yen has faced structural devaluation due to the Bank of Japan’s historic persistence with ultra-low interest rates while the rest of the world hiked. While unhedged foreign investors saw their local nominal returns significantly diluted by a weaker Yen over the last decade, the currency is showing signs of cyclical structural bottoming as monetary policies slowly begin to normalize globally.
Taxation Regime: Japan maintains a clean and straightforward statutory withholding tax rate of 15.315% on dividends for non-resident individual investors. This is often optimized further via tax treaties down to 10%. Capital gains for non-residents without a permanent establishment in Japan are generally exempt from domestic taxation.
Tentative Net Return Outlook: ~7.0% to 7.5% (assuming currency stabilization). If the Yen stabilizes or appreciates from historically cheap levels, net returns for foreign investors could outperform local index returns moving forward.
3. The Chinese Market (Benchmark: SSE Composite / MSCI China)
The Chinese equity market is heavily disconnected from its GDP growth, characterized by high regulatory interventions and a structural pivot toward “state-directed capital.”
10-Year Average Historical Return: ~3.5% to 4.5% annualized (highly volatile, with long cycles of stagnation punctuated by sharp policy-driven rallies).
Currency Trend (CNY/CNH): The Renminbi is tightly managed via the People’s Bank of China’s (PBOC) daily fixing rates. Given China’s domestic deflationary pressures, real estate deleveraging, and lower interest rates relative to western nations, the yuan faces a structural depreciation bias. The central bank actively manages this to prevent capital flight, resulting in a slow, controlled downward grind against the USD.
Taxation Regime: For foreign institutional and individual investors investing via standard channels (like Stock Connect), a statutory 10% withholding tax is applied at the source on dividends. Capital gains realized by foreign investors trading A-shares are currently subject to temporary tax exemptions to encourage foreign capital inflows.
Tentative Net Return Outlook: ~2.0% to 3.0%. Low baseline historical returns, compounded by a persistent currency headwind, leave the net drag high despite the favorable 10% tax rate.
4. The South American Market (Benchmark: MSCI EM Latin America)
South America, heavily weighted toward Brazil and Mexico, is a cyclical, high-beta play dominated by commodities, materials, and banking.
10-Year Average Historical Return: ~8.0% annualized (MSCI EM Latin America USD Total Return Index), though characterized by extreme boom-and-bust cycles.
Currency Trend (BRL, MXN): Commodity-dependent currencies present massive volatility. While Mexico’s Peso experienced strong macro tailwinds from “nearshoring” trends, Brazil’s Real has faced a decade-long structural depreciation path due to fiscal deficit spending and political risk. On average, expect an annualized currency friction drag of 2% to 4% over long horizons in unhedged terms.
Taxation Regime: Highly variable by country. Brazil is unique and traditionally highly favorable; it imposes a 0% withholding tax on standard dividends paid to foreign non-residents (though “Interest on Equity”, an alternative corporate payout structure, is taxed at 15%). Mexico levies a 10% withholding tax on dividends. Capital gains taxes for foreign investors are frequently waived on listed, liquid exchange transactions to incentivize external liquidity.
Tentative Net Return Outlook: ~4.5% to 5.5%. While the tax treatment on direct dividends is highly competitive, the structural inflation differentials and commodity exposure mean that currency depreciation eats a significant portion of local equity gains.
⚠️ Disclaimer: Tentative and Conservative Projection
Please Note: The net return calculations provided above are purely illustrative and intended to serve as a conservative, tentative example calculation. They are based on long-term historical averages and do not represent a guarantee, projection, or precise forecast of future performance. Actual returns will fluctuate based on real-time market movements, macroeconomic cycles, and fund-specific tracking errors.
Historical Context: Cycles of Superior Performance in INR
While a conservative average provides a baseline for long-term financial modeling, international indices frequently deliver outsized, superior returns in Indian Rupee (INR) terms during specific market cycles. This outperformance is typically driven by two engine rooms: structural rallies in the home country’s equity market and the natural compounding effect of currency depreciation (USD, EUR, or JPY strengthening against the INR).
Historical cycles that yielded stellar performance for Indian investors include:
1. The US Tech & Large Cap Surge (2019 – 2021)
During this multi-year window, the S&P 500 and Nasdaq-100 indexes delivered exceptional absolute performance. When paired with the steady depreciation of the INR against the US Dollar, local feeders and Fund of Funds (FoFs) provided massive alpha to Indian portfolios.
2. The European Post-Pandemic Cyclical Rally (2021)
Led by the recovery in banking, luxury goods, and automotive heavyweights, the Euro Stoxx 50 experienced a powerful structural rally. For an Indian investor, this euro-denominated growth was amplified by currency translation effects as the INR depreciated against the Euro over the broader multi-year macro cycle.
3. The Japanese Corporate Governance Renaissance (2023 – 2024)
The Nikkei 225 broke through its historic multi-decade highs, fueled by extensive corporate governance reforms, yen weakness, and shifting global capital allocations. Despite the Yen itself facing depreciation pressures globally, the absolute underlying index gains were so aggressive (exceeding 25–28% in major calendar stretches) that local international funds capturing Japan delivered superior, top-tier returns to Indian investors when translated back into INR.
True macro clarity means realizing that global investing is a chess game of physical and structural dependencies, not an exercise in tracking where a U.S. tech giant happens to sell its next device.
Join the Conversation:
How are you currently structuring your geographic asset allocation? Are you exposed to the upstream hardware layer in Asia, or are you heavily weighted in domestic software frameworks? Let’s talk in the comments below.
Looking for our sister publication on personal finance, risk planning, and building a resilient financial foundation from the ground up? Head over to LinkedIn and join our community at The Clarity Letter.